Insights
better business decisions
Posted 3 years ago | 4 minute read

FERC assesses state of the markets
The Federal Energy Regulatory Commission (FERC) has issued its latest assessment of trends in Regional Transmission Organizations/Independent System Operators and other wholesale markets in the US.
Published on 21 April the 2021 State of the Markets report, noted that the long-term trend of the power generation resource mix moving away from fossil fuels towards renewables continued, but there were a number of noteworthy events that affected market outcomes. It noted that natural gas prices increased significantly in 2021, with Henry Hub averaging $3.82/MMBtu (million British thermal units) compared to $1.99/MMBtu in 2020. Prices have continued to increase in 2022 and have averaged $4.54/MMBtu through March, 14 2022.
Average natural gas spot prices
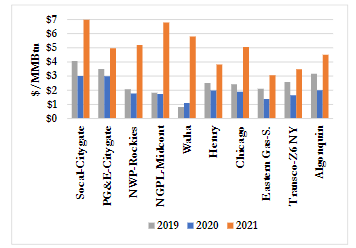
Source: FERC
Higher prices for natural gas-fired generation led to increased competitiveness of coal-fired generation, and declining coal stockpiles in the fall, while higher natural gas prices caused higher electricity prices with increases at all major electric pricing hubs. Wholesale electricity prices increased in 2021, after two consecutive years of decreasing prices.
Weather events also continued to affect natural gas and power markets, signaling to grid operators the need for market improvements. Several markets were heavily affected by the February 2021 winter storm Uri, which caused prolonged and extreme cold weather across much of the US. The storm caused significant price spikes and load shedding in the ERCOT region and, to a lesser extent, the SPP and MISO regions.
Change in mean and median day-ahead on-peak electricity prices (2020-21)
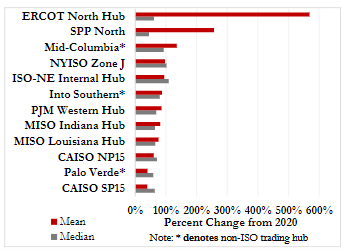
Source: FERC
Longer-term trends in capacity continued, such as investment in new capacity, with most new generating capacity coming from natural gas-fired, wind, and solar resources. Battery capacity grew significantly, nearly equaling the capacity of new additions from gas-fired generation. New generating resources have seen continued growth but have encountered delays created by grid operators’ interconnection queues.
As of December 2021, natural gas represented 46% of the RTO/ISO capacity mix, followed by coal at 18%, wind at 14%, and nuclear at 8%. Some RTO/ISOs experienced relatively large changes in their capacity mixes between 2020 and 2021, including the increase in battery storage capacity in CAISO from 0.7% to 3.2% of its capacity mix and the increase in wind capacity in SPP from 26.8% to 29.5% of its capacity mix. Solar capacity in ERCOT rose from 4.1% of the resource mix in 2020 to 7% in 2021.
Generation capacity by fuel type (Dec. 2021)
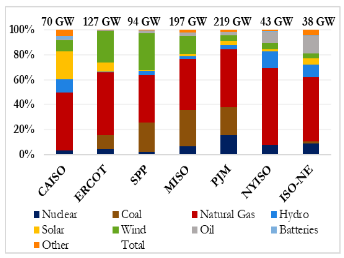
Source: FERC
Distributed energy resources (DERs) moved toward deeper integration with wholesale markets, as the RTO/ISOs made progress on Order No. 2222 compliance. Order No. 2222, issued in September 2020, enables DERs to participate alongside traditional resources in organized wholesale electricity markets through aggregation. To comply with the order, RTO/ISOs must establish rules governing participation of DERs in their markets. CAISO and NYISO submitted their compliance filings in July 2021, PJM and ISO-NE sent their compliance filings in February 2022, and MISO’s and SPP’s compliance filings were due in April 2022. DERs are not currently tracked in the same manner as traditional generating resources. As RTO/ISOs comply with Order No. 2222, DER participation is expected to increase and higher quality statistics on their participation in the markets will become available.
GridBeyond SVP North America Wayne Muncaster said:
“This report demonstrates the scale of the challenge facing power systems and it is striking how complex the energy transition has become. Higher natural gas prices make renewable energy more cost-competitive but because solar, wind and energy storage projects are stuck in backlogged interconnection queues, they are not getting built fast enough. This has meant that the increase in gas prices instead led to a 20% increase in coal-fired electricity generation in 2021 compared to 2020, despite continued retirements. ERCOT, MISO, SPP, and PJM all had increased output from their coal facilities, and this despite 3.7 GW and 1.5 GW of coal retirement in MISO and PJM, respectively.
“It is good news that capacity additions from battery storage increased from 0.5GW to 3.1GW in 2021, mostly driven by projects in CAISO and ERCOT. This is a trend that we are expecting to continue as grids move towards a zero-carbon future, there will be an ever-increasing need for technologies that are able to ramp up and down to balance the system. Whether its battery storage, industrial load or crypto miners, there are numerous assets that can, if optimized, can provide these services.”

Latest energy insights
-
 Press Release
26 March 2026
3 minute read
GridBeyond and Optima Energy sign agreement to help customers unlocking new revenues
Read More -

26 March 2026
4 minute read
How AI is helping data centres lead the next wave of grid flexibility
Read More -
 Brochure
24 March 2026
1 minute read
Whitepaper| USA | Risk transfer solutions in merchant energy markets | Downside protection strategies for battery storage assets
Read More -
 Press Release
17 March 2026
3 minute read
Samsung Ventures joins GridBeyond’s shareholder base as part of a €12M equity investment
Read More -

16 March 2026
4 minute read
What is demand flexibility and what opportunities does it offer businesses?
Read More -

16 March 2026
2 minute read
Government reforms could see data centres prioritised in connection queue
Read More -

16 March 2026
7 minute read
From volatility to value: how businesses can take control of their energy future
Read More
